
News · · 9 min read
Anthropic's Internal Employment Report: Junior Share of Technical Hires Fell From 27% to 9%, and Reading Became the Bottleneck
In this post
On October 16, 2026, Anthropic published "How employment is changing at Anthropic," a report built on the company's own internal data. It makes two headline claims. The junior share of new technical hires dropped from 27% to 9%, and by August the Claude agents that employees launched themselves were running six times as many hours as the employees worked. What got busier in return is human reading. The report estimates that even non-technical staff would need more than half of their work week to read everything Claude produces in their interactive sessions. Every one of these figures was measured by Anthropic itself, and as far as we could find through October 19, no outside party has reproduced them.
This post covers what the report measured and what it left out, a single chart of the share metrics that moved over the past year, agent hours and output tokens converted into human time, the shift in interview criteria, how Hacker News read it, and what it signals for developers outside Anthropic.
What the report measured, and what it did not
This is not a product launch. It is a technical report from Anthropic's economics researchers: Nathan Wilmers, Regina Catipon, Maxim Massenkoff, and Peter McCrory, credited to The Anthropic Institute. The data covers employment, AI usage, output metrics, employee surveys, internal communication patterns, calendars, and hiring decision records, supplemented by 17 employee interviews.
The gaps matter as much. The report gives the junior share of hiring, not the number of junior hires. The same report says the company tripled in size over the past year, so the absolute number of juniors could have grown even as their share fell. The output metrics count volume: commits, contracts processed, deals closed. Code quality is compared only through the rate of lines later deleted or reverted.
How the report's share metrics moved
Six share metrics are scattered through the report's text. The chart below puts each one's before and after value on the same axis. The time window differs by metric, so read the period in parentheses alongside each row.
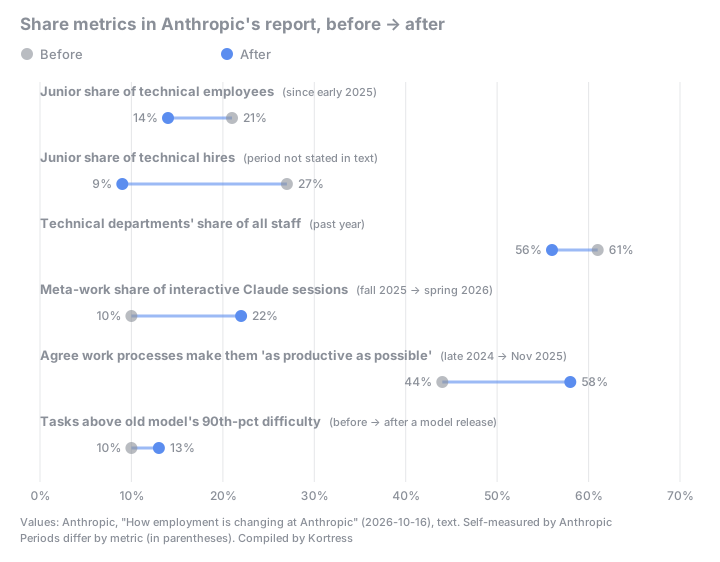
Junior hiring moved the most. Since early 2025, juniors fell from 21% to 14% of employees in technical departments. Their share of technical hires fell even faster, from 27% to 9%. The report says junior postings dropped especially sharply after December 2025. Talk of falling demand for junior technical staff surfaced internally in January 2026, and by April engineering and research teams had deemphasized hiring for lower-band technical roles. In a survey that same month, around a third of ML managers and a fifth of SWE managers said they were hiring less because of AI.
Other functions did not absorb the slack. Technical departments fell from 61% to 56% of all staff, but the report says technical hiring kept growing in absolute terms while sales, finance, and recruiting grew faster. Hiring did not accelerate in administrative functions, which usually scale with company size, and even clerical work tied closely to in-person interaction grew slowly. Coding-focused agent sessions among non-technical employees (those with no code commits at baseline, excluding new hires) went from 2 per month in August 2025 to 90 in May 2026.
The remaining three metrics describe how work, and how people see it, changed. The share of employees agreeing that work processes made them as productive as possible rose from 44% in late 2024 to 58% by November 2025. In April 2026, 75% said yes, but the report notes the question was weakened by dropping "as possible," so that figure should be read separately. "Meta-work" rose from 10% of the average employee's interactive Claude sessions in fall 2025 to 22% in spring 2026. Meta-work means building the tools that get work done rather than doing the work: skills, plans, and reviews for other agents, or dashboards that monitor agent pipelines. When a new model ships, tasks above the old model's 90th-percentile difficulty rise from 10% to 13% of all tasks, while the easy end barely changes. The report reads this as employees starting to tackle harder problems with agents as soon as a new model is available.
Six-to-one agent hours and the reading bottleneck
The six-to-one figure only makes sense once you see how it is counted. The report includes only interactive sessions launched by employees, with subagents pooled in. Agent time is runtime, including inference and active tool use, minus any wait longer than 30 minutes. Human time is headcount times 40 hours a week. Under those assumptions, six-to-one means 240 hours of agent runtime per employee per week (40 × 6, our calculation). Counting autonomous fleet agents as well, total agent hours had already passed human hours in March 2026.
Most of that agent time is spent waiting. The report measures roughly 80% of interactive session time as idle, waiting for human input. The bottleneck is the person, not the model.
The report turns that bottleneck into reading time, assuming 0.75 words per output token and 250 words read per minute. Using the same assumptions, we calculated reading time at several weekly output volumes.
| Weekly output tokens | Words (× 0.75) | Reading time (÷ 250 wpm) |
|---|---|---|
| 10,000 | 7,500 | 30 min |
| 100,000 | 75,000 | 5 h |
| 400,000 | 300,000 | 20 h |
| 1,000,000 | 750,000 | 50 h |
Half of a 40-hour week is 20 hours, which works out to 400,000 output tokens. So the report's claim that non-technical staff face more than half a work week of reading is equivalent to each person receiving over 400,000 tokens a week from interactive sessions. The word conversion is English-specific and does not carry over directly to other languages, where characters per token and reading speed differ.
People are attacking the bottleneck with tooling. Written standing instructions for agents grew from a few hundred in July 2025 to 8,500 a year later. One engineer built an agent "chief of staff" to triage requests from other agents. Meetings still grew: calendar data shows the median employee spending 20% more time in meetings than a year earlier. The report attributes part of that to company growth and a shift toward meeting-heavy non-technical roles, but even technical individual contributors are up 16%.
How output was compared
The productivity figures compare employees working in the same month, which tries to hold the shared business context, including company growth, constant. The report compares 192 engineers who adopted coding agents with 74 who had not yet adopted them, month by month. Code added rose sharply after adoption, and commits per engineer reached five times their level six months earlier. When code written by the same person, in the same month and directory, was split into human-written and agent-written, there was no difference in the rate of lines later removed or reverted.
The report names the weakness itself. Adoption was not random, so if people about to start a big project tooled up first, the effect is overstated. Engineers who moved to fully autonomous agents were in fact already on a steep upward trajectory before adopting them. At the company level, it says that five years after founding, Anthropic brings in 2 to 4 times as much revenue per employee as Meta and Google did at the same age, based on their 10-K filings and deflated to 2025 dollars.
Shifting interview criteria
The change in hiring criteria comes from an automated pass over interviewer scorecards for thousands of employees hired since 2024. In 2024, about 5% of assessments for technical roles and 7% for non-technical roles mentioned a candidate's track record with AI tools. By 2026, the report says, that rate had tripled for technical roles and quadrupled for non-technical ones. Multiplied out, that is roughly 15% and 28% (our approximation; the report gives only the multiples).
In technical interviews, the biggest increases were in comments on autonomy and judgment, while domain expertise shrank as a share of the assessment. One manager put it this way: "I expect models to continue to be jagged, so for my team I want them to be fungible across domains." For non-technical roles, customer and mission orientation rose while execution skills fell.
How Hacker News read it
The Hacker News submission had 115 points and 196 comments when checked on October 19 (discussion). Among the top-level comments we read, skepticism about the measurements and the motive stood out, though some agreed with the direction of the hiring changes.
The skeptics' first point was the junior pipeline. User OuterVale wrote, "As obvious as it seems to say, with no new juniors there will be no new seniors" (comment). The second was the output metric. User voidhorse objected to presenting more code per person as an achievement: "Every line of code is a liability, not a trophy" (comment). The third was intent. User pyrale wrote, "There simply is no way to separate what's reporting and what's advertising" (comment), and user usernametaken29 noted the absence of any comparison with hiring cycles at companies that are not AI labs (comment).
Those who agreed focused on the hiring criteria. User Jackobrien wrote, "'Junior' is the wrong distinction to make. I've recently worked with senior engineers who are terrible at wielding agents, and recent grad engineers who multiple themselves 100x" (comment), and listed curiosity, agent coordination, and clear communication as what they look for. Some withheld judgment and asked questions instead. User bjornsing said the biggest question for working people is whether Anthropic hired less because of productivity gains or is simply doing more engineering for the same money (comment).
What it signals for developers elsewhere
For junior candidates, the report reads less like "hiring has stopped" and more like "the evaluation criteria have changed." A headline from The Decoder said Anthropic had nearly stopped hiring juniors, but only the share was disclosed, and the company tripled in a year. The firmer change is that mentions of AI tool track records in interview scorecards tripled for technical roles. A portfolio that shows what you delegated to agents and what you decided yourself, not just the finished result, looks like the stronger bet.
For teams rolling out agents, the reading-time table is the more practical takeaway. Once a team member receives more than 400,000 output tokens a week, half their working hours go to reading. The exact ratio shifts for non-English output, but the framing holds: agent output volume is human reading time. That is the case for scheduling meta-work, such as tidying instructions, building review agents, and setting up dashboards, from the start.
Projecting these numbers onto an ordinary company is harder. Anthropic builds the models, so its token costs and how early it gets new models are likely different from most employers. The report itself says many of its employment practices cannot be replicated across the economy. What generalizes is the direction of the change, not the size of the percentages.
Limitations
| Item | Detail |
|---|---|
| Who measured | Every figure is Anthropic's own measurement. The report releases no raw data. We found no third-party reproduction as of October 19 |
| Performance axis | Not a model launch, so there is nothing to benchmark; this post has no benchmark comparison |
| Absolute numbers | Junior hiring and employment disclosed only as shares; headcounts unknown |
| Output metrics | Volume measures such as commits and deals. Quality compared only via deletion and revert rates |
| Causality | Tool adoption was not random, so productivity effects may be overstated (the report says so itself) |
| Figure 1 | Periods differ by metric; the text gives no separate period for the junior share of hires |
| Our calculations | 240 hours per week, the reading-time table, and the 15%/28% interview figures are our own calculations from the report's assumptions and multiples. Reading conversion is English-based |
| Motive | Hacker News user gumby said the report reads like advertising for an IPO |
| First-hand data | This post is a review of a public report; it contains no measurements of our own |
Sources
- Anthropic, "How employment is changing at Anthropic" (2026-10-16): https://www.anthropic.com/research/employment-at-anthropic
- Report PDF: https://www-cdn.anthropic.com/72628f1863c53432195db83279252dfd2cb53158/Employment%20at%20Anthropic.pdf
- Hacker News discussion: https://news.ycombinator.com/item?id=50139873
- The Decoder: https://the-decoder.com/anthropic-has-nearly-stopped-hiring-junior-staff-because-ai-agents-now-work-six-times-as-many-hours/